Clustered applications, shared resources and concurrent processing
In modern world, it is rare for a mature application to operate in a standalone monolithic mode when is not replicated in a cluster or does not access any shared resources. Normally, it is safe to access shared resources for reading, or if any concurrent updates may be ignored. However, sometimes applications must face a situation where concurrent access can lead to system inconsistency, data errors or major performance problems.
To avoid such situations, it’s common in concurrent programming to protect critical sections with locks that change their behaviour in distributed systems where processes run in different environments, i.e., different Java virtual machines, isolated hardware, or computer units running in a cloud.
There are several ways to implement locking and each of them increases complexity and affects performance, so we always need to make a weight decision about which approach best suits our needs.
There are two common cases for using locks:
- it optimizes performance or protects against (relatively harmless) inconsistencies, such as triggering a computational process whose results are ignored, sending repeated notifications to users, duplication of non-vital entities
- or leaving critical sections unprotected could break the correctness of the system and produce critical business errors, e.g. wrong financial transactions, wrong interpretation of medical diagnostics results or vehicle accidents.
Taking these differences into account, we go further and discuss the feasibility and applicability of distributed locking systems add use Redis as a concrete example.
Protecting critical sections using locks with Redis
Consider having some clustered application (or multiple of them accessing concurrently important resource and having access to shared Redis).
Redis is a great tool for caching and storing any distributed data and if you already have it on your stack, you could consider it for implementing distributed locking also, otherwise It could be wiser to pick something up already present there, like e.g. ZooKeeper, or adapt some micro-service to serve as holder of distributed lock or just implement classical database-locking.
If nothing similar is present, Redis is a great tool and introduction it just for locking purpose still could safe a lot of time later, when you decide to store any other distributed data, or I you’d be looking for a reliable tool for caching.
The examples are implemented in Java, but the principles should stay the same for other languages also.
As a disclaimer, there are good tools and frameworks that implement distributed locks using Redis, such as Redisson, but before we use them, let’s first look at a simple example with only Java and Redis connection (with support of de facto lean Java standard - Spring Boot and integrated with it Spring Data for Redis).
We could re-implement Redisson logic by our own, for exmaple, because we want to avoid any additional frameworks in our tech stack. The most important part for me is to emphasize how easy it is to implement locking on your own and what additional benefits we could gain in monitoring and troubleshooting concurrent access.
Basis implementation
But words are cheap, let’s look at the code.
The most simple implementation of lock (beware: partially broken):
github:e9ad5dbb8da77ac8800dc92065479eff
Full code of the class can be found at our GitHub.
And small helper class:
github:6bcb04e08ef76e9493917ddad416c18d
Before executing the given Runnable, first we create an identifier of lock attempt - LockAttemptId using:
- pre-configured on startup identifier of the application appName
- fixed among all applications lockName
- current timestamp
- uniquely generated id
and try to obtain the lock by associating the Redis key lockName having fixed expiration lockExpiryMillis with an unique string value composed from LockAttemptId. Having such a value in Redis as a string is very helpful for manual debugging using Redis CLI. It allows investigating the value associated with a lockName easily. For example:
- is the lock obtained right now - by presence of the associated value
- which application owns it - see appName
- when the lock was obtained - see timestamp
- when the lock will be auto released - see TTL
[Notice: here we using simple RedisTemplate from org.springframework.data.redis.core to establish the connection to Redis.]
If no Redis key lockName is present, the lock is acquired and no other execution is allowed for least lockExpiryMillis or the actual time taken byRunnable to finish its execution. If the Redis key is present, the lock is not acquired and the process just exists with boolean false as indicator that the lock is busy.
The given code uses the basic Redis functionality to place keys with fixed expiration - TTL (more about in on Redis site), which are automatically deleted after time expires. The exact TTL can be calculated separately for each application based on the estimated execution of the Runnable. This TTL determines how long this application has the lock and is therefore protected against simultaneous execution with other applications.
This algorithm guarantees us:
- it’s deadlock-free because of autorelease using Redis mechanism of TTL: the key and thus the lock is deleted after a given expiration if the process acquired the lock died, got paused or something else happened
- provides mutual exclusion because a single client can hold a lock
- lock will be released when code execution finishes (even with exception)
- code is wait-free and any given task doesn’t have to wait until the lock will be released and just exits early detecting concurrent execution
But the algortihm has problems:
- when the application dies while holding the lock, other clients will have to wait TTL before getting access to the critical section protected by the lock
- race conditions can occur when it takes more than TTL until the application holding the lock finishes execution. In this case, Redis automatically removes the lock and other applications take into account that no other execution is currently running. We will address to this problem later.
It also has one bug, which we will fix in the next section.
Releasing the lock correctly
The code above has a problem: if it takes more than TTL for the process owning the lock to finish execution another client might take the lock and start its execution concurrently.
Apart from the fact that it is a cornerstone of locking in distribution systems, that we will discuss later, the delayed process in the given code will break the given guarantees of mutual exclusion even within specified TTL, since it will delete any lock at the end, even those created by other processes:
github:a18f698f7bf989420afcc3f8f374b4ad
thus allowing all other applications to obtain the lock by placing a new key to Redis.
A solution would be to first check wheather the key to be deleted (and thus the lock being released) still belongs to the given process. And do nothing when the initial key already expired or another application already owns the lock.
It’s simply to implement using integrated in Redis Lua scripting engine by checking the associated value before deleting the lock key:
github:a7d7410ed4e9d58b8172a59d0592285b
Link to the GitHub.
In this code it is safe to first get the value of the key and save it to current variable and later call del on the key: Redis uses the same Lua interpreter to run all the commands and it also guarantees that script is executed in an atomic way:
- no other script or Redis command is executed while a script is running, so the effects of all other clients of a script are either not yet visible or have already been completed.
- and if a key with expiry (TTL) exists at the start of eval, it will not get expired during the evaluation of a script.
The process either deletes the key it placed before the execution and return it as a result, or deletes nothing and returns the currently associated value. The key placed by the given process because it has expired and is automatically deleted, possibly already associated with another value by another process.
But even if we correctly delete keys placed by the same process, we still have a race condition in that case.
Distributed locking and race conditions
In this chapter I would like to discuss the situation about the existence and general impossibility of avoiding race conditions in systems using distributed locking.
After an application obtained a lock it is almost impossible for other applications elsewhere to get a reliable answer if the process holds the lock because it still running or because it has died and had no chance to release it.
If a process holding the lock exceeds the initially claimed lock expiration, there are several causes for it:
- processing took more time than expected and the process actively performs a computation or waits for response from some external system
- the whole system got paused or the whole underlying system is overloaded
We could develop an algorithm to lock more robustly and safely against race conditions by adding a heartbeat-process (like Redission does) that extends the remaining TTL for some time until process ends an execution, but this would increase the complexity and even the heartbeat could be suspended in the second case, when the system is completely overloaded or paused (e.g. in the world of JVM when stop-the-world pauses occur).
Even considering another distributed locking algorithm as used by ZooKeeper, where lock is released when process is completely detached and not paused - we still have to deal with network problems, where packets could be delayed, lost or found and a system that is considered to be dead, comes back to life and accesses shared resources after other parts of the system considered them to be released.
In case of locking on Redis the situation is even more complicated, when we have not a single shared instance of Redis but a cluster or master-slave replication.
For example one of situations described in RedLock algorithm, it could happen, that:
- client A acquires the lock on master node of Redis
- master node dies before it replicates its state to any of the slaves (because Redis has an asynchronous replication mechanism and it is not possible to do a write with confirmation about successful replication )
- the slave with missing information about lock gets promoted to master
- client B acquires the lock on new master node, because the node misses information about the key placed by client A - we will have two processes running concurrently under the same lock.
Even suggested RedLock algorithm is still arguable regarding its reliability and race conditions safeness in clustered Redis environment, there is a review by Martin Kleppmann.
Summarizing, I would rater accept the fact that in case of distributed locks race conditions are almost impossible to avoid and there are only several ways to improve the situation:
- develop systems safe to concurrent read and writes
- increase robustness of the locking algorithm against race conditions and reduce them to minimum
- react to arising race conditions with least possible delay
Since the first one depends completely on any given case and the second one does not generally prevent the occurrence of race conditions, we should distinguish, how critical it is that in certain circumstances sometimes the locked resources are accessed concurrently. I would focus on the third point and propose some advances in this direction.
Monitoring lock state and collecting metrics
Log so informative as possible
The first step towards solve software problems is reading logs. Logs must be as informative as they are concise.
With concurrent access and locking there are at least the following log-worthy situations:
- application X attempt to acquire lock Y at time T
- application X acquired lock Y at time T
- application X failed to acquired lock Y at time T
- application X released lock Y at time T
- lock Y expired at time T
- discovered race condition between applications X and Y at time T
With our implementation, we could introduce logging on the following places:
github:167850c921859c3ab86342daf0edbe45
Link to the GitHub.
using the following methods for logging:
github:17aff4f1000d8165f817165cde608e70
will log Redis key and value consisting of lock name, application name, unique id and timestamp
github:5576c55ec7ae66ffaa794232a3d54dc0
will log key and value in case if Redis key already exists and not yet expired
github:ec4de33964cb5c5e8e746a555125ae70
will log key and value in case if new Redis key was successfully placed
github:0aab1dd02ff756b44d07a1be49e3c888
will log if process finished its computation after redis key placed on beginning of the computation was somehow deleted - this case is important, since if the key was expired another process could have obtained it and finished computation prior to this moment. It looks like typical ABA problem, and we cannot ignore it.
At this time it is not yet clear whether it happened or not. But investigating logs about successful obtaining of locks prior to given time, we can later recover, if any application had done it, at what time, and which consequences the situation may have.
github:e34b0b3a6fdc9228a04ab77bf4fb7724
will log if process finished its computation after Redis key was somehow replaced by others - that means it was expired and another process is currently working in parallel. It is generally possible to perform a rollback of changes done under the lock by given process, but we should at least provide a log entry.
By giving information we would be able to track down the race condition investigating the logs. Although it’s not open source, I’d recommend to check Splunk for logs aggregation and querying - it is one on the most pleasant experience with logs investigation I’ve ever had.
Importance of metrics
Logs are vital for maintaining systems and are the first place to look in in case of some incidents but logs cannot prevent incidents - you can monitor them in real time or have an error-free logs policy, where each log entry with ‘error’ level creates an incident ticket, but it is still unhandy.
In addition every software system is obligated to have monitoring. Monitor everything: CPU load, free memory, cache size, durations of http requests, amount of sessions, average execution time of critical code fragments and so on.
In our case we want to have metrics for our locks which give us an answer to the following questions:
- which application owns the lock at most
- how long is lock usually taken
- how often race conditions happening
Beside we would like to have alerts if applications are in race.
The most typical approach places metrics in memory as time series and asynchronously batches them into a storage optimised for storing and accessing time series, either local or (usually) remote.
Influxdb to store time series
For generating and storing metrics, I’ll show how to produce and send relevant metrics into a open-source solutions for time series storage - Influxdb.
First, lets create a Spring configuration and corresponding bean for storing metrics;
github:1250e3de7d9dfca5416b3130a8e8f92b
Link to the Github.
Besides of configuring the bean and connection to the host with influxdb instance, we also configure batch commitment of metrics, to avoid sending a request for every single metric. In our case we will send them in a batch with size 100 or just every 10 seconds otherwise.
Next, by wrapping the instance into a simple collector, tagging and adding custom fields to our metrics are easier:
github:1d4ba4b1e559bbb65d39bd76e5181d33
We adapt our notify methods to produce all necessary time series among the logs:
github:b2a489da4673604a620ce58144742975
here we send a metric using timestamp of attempt to acquire the lock and lockName (from lockAttemptsId.getKey()) as key of time series, lockId as unique field for time series and provide appName and eventType (with fixed value ‘lockAttempt’) as custom tags for the subsequent aggregation
github:8c1c817123e625d3906141067ed4e858
the same situation here but with value ‘lockBusy’ as value for tag eventType
github:4568ded399c695cb64a2b5c879b27c01
as before but ‘lockSuccess’ as value for the tag here
github:dcec5987d34953104204679868dc27ba
we submit current time as time for time series, provide a difference between initially set TTL and actual duration of the execution for field ‘lockExceedDuration’ and use ‘lockRace’ for eventType. Since we don’t know if concurrent execution took place after lock expiration or not, we provide ‘unknown’ as value for a custom tag raceType
github:b91080ab0130509930732e7cf4166a68
We know, that there is a parallel process owning the lock right now, so we report this metric with raceType set as ‘race’
As usual Github for the full class.
Now we have a pretty simple distributed lock on Redis, relevant logging of every process accessing it and metrics to see what’s happening in a big picture.
Using Grafana to represent time series
What is missing it is a tool for visualisation of our time series, as SQL-like querying of time series doesn’t differ as much from reading plain logs.
I’d show how to visualise and see our metrics live using an open source monitoring solution - Grafana.
I’ve created a very simple application, which tries to acquire the lock, simulates processing by randomly sleeping and waiting before the next attempt.
We start three instances of it simultaneously with names ‘Diego’, ‘Gorn’ and ‘Milten’ and let them to compete for a Redis lock named ‘sweetroll’ having the same expiration 5 seconds for each of them.
Here is the code:
github:783780923cfa012fa6c6dee852edaabb
which could be found any time at our GitHub.
To quickly launch the applications and bootstrap the infrastructure consisting from Redis, Influxdb and Grafana, I use docker-compose. The file can be found at GitHub.
If you want to play and watch everything happening live, you should clone our github repository with:
shell:git clone https://github.com/comsysto/redis-locks-with-grafana
build the application using Maven:
shell:mvn clean install
run docker-compose (may take a while to download necessary images):
shell:docker-compose -f docker-compose-redis-standalone-grafana.yml up --build
open browser and go to http://localhost:13000 and login into Grafana with admin/admin login/password (just skipping next screen offering to change credentials) as set by default in docker image.
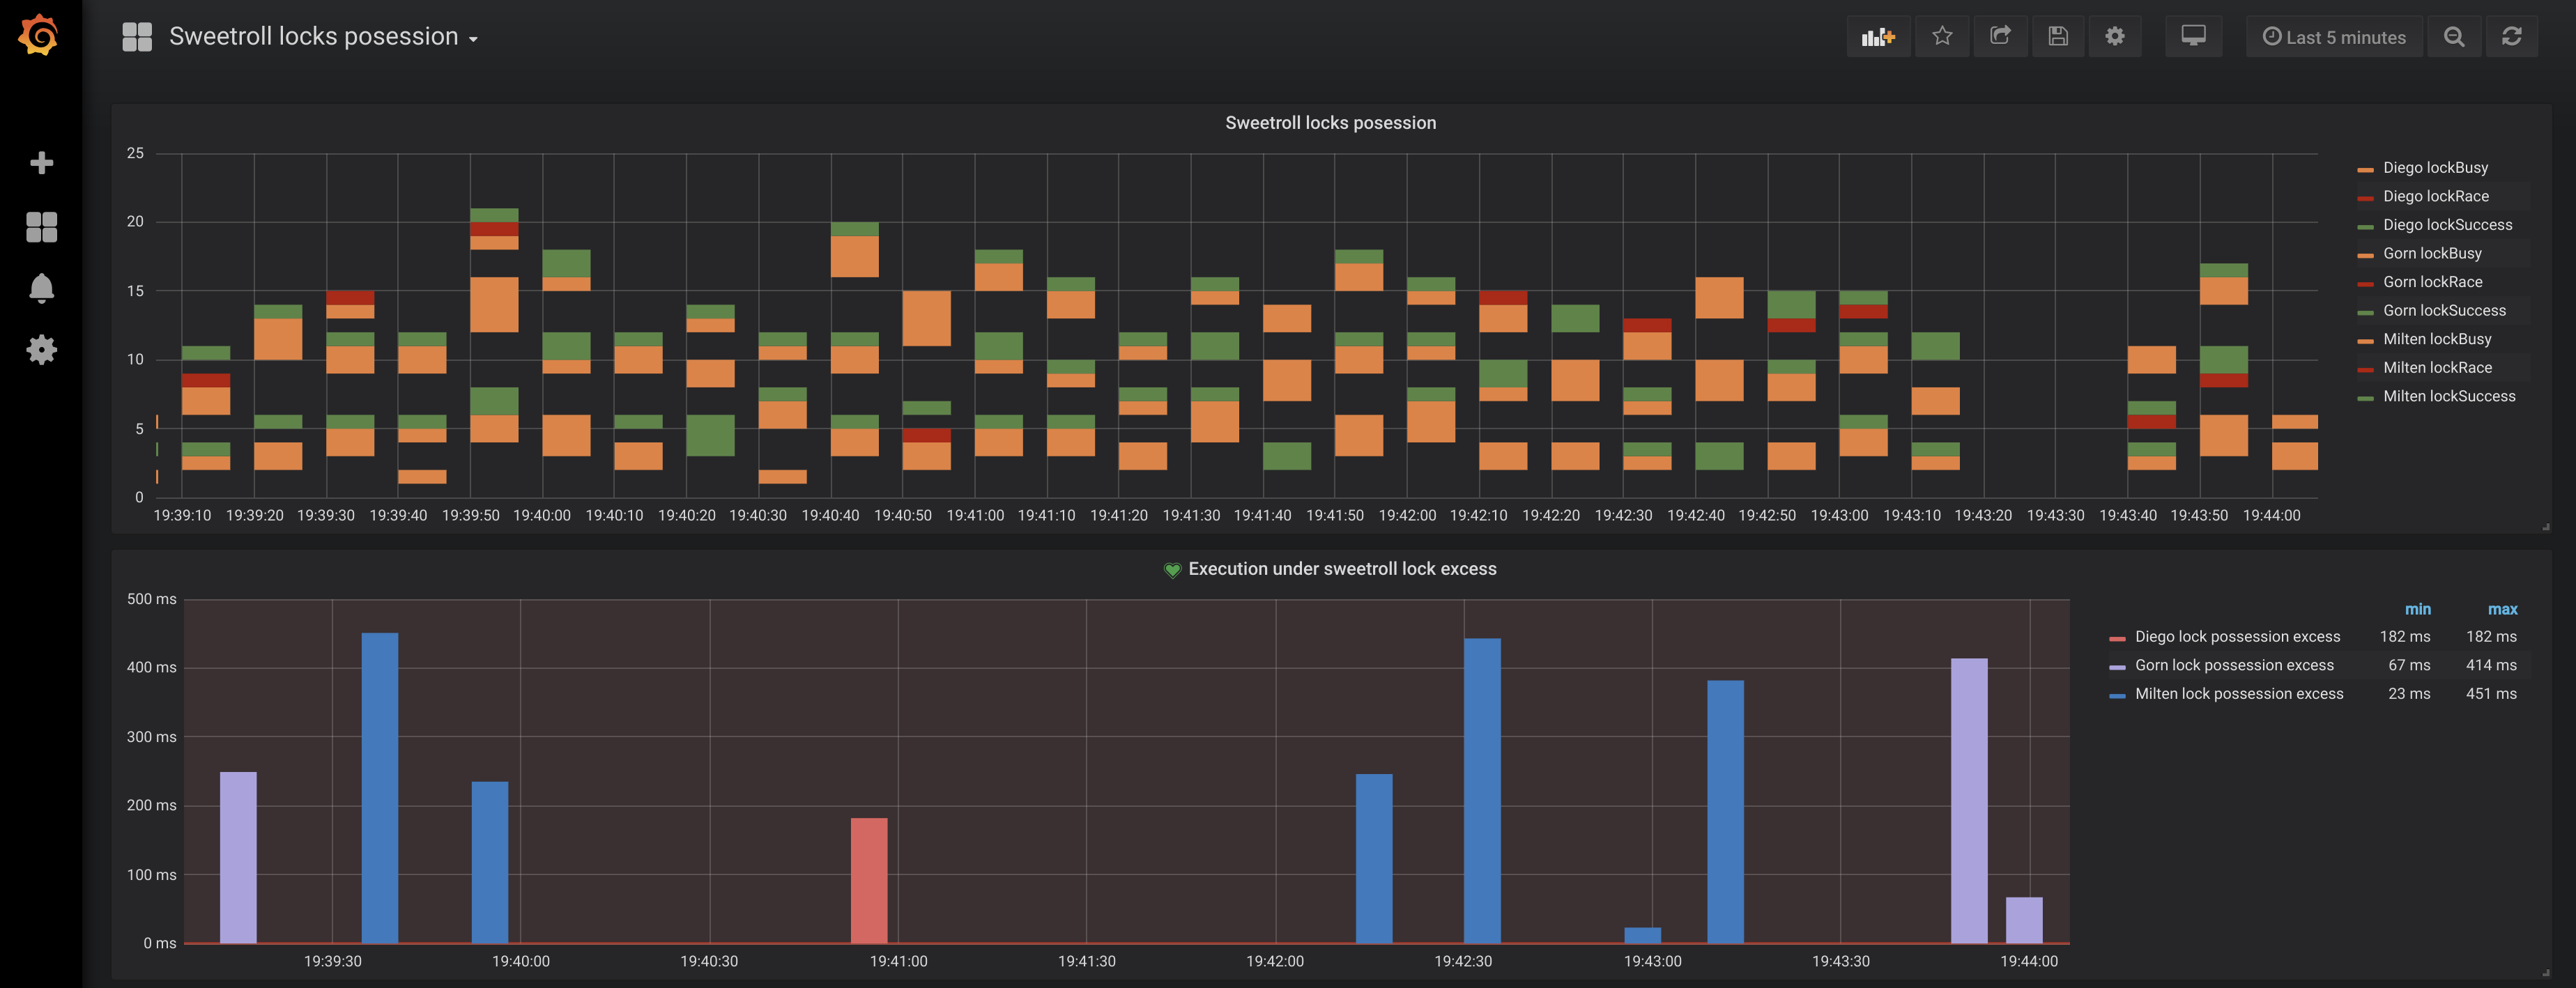
What you’d see is something like this:

Lets look into explanation of each dashboard.
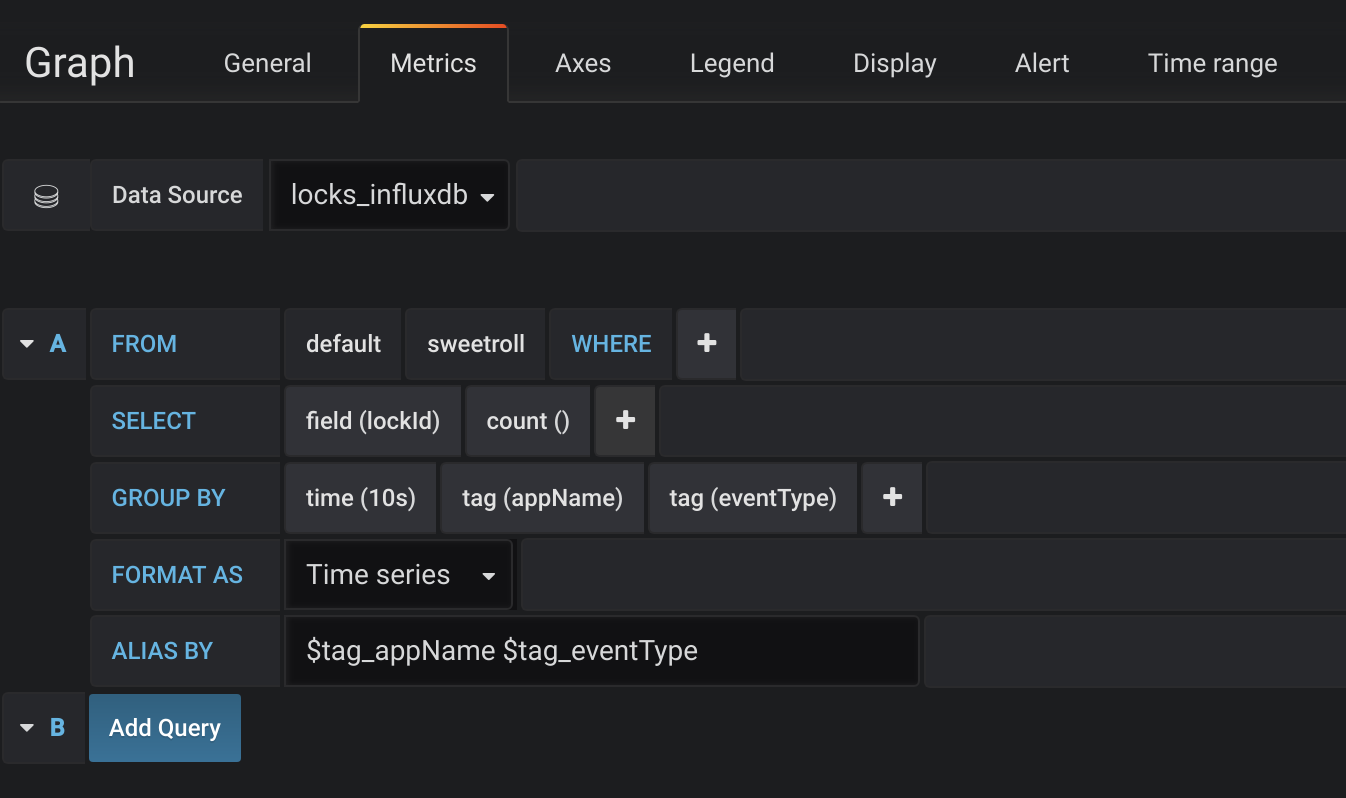
First (most top) one has the following configuration on metrics tab:

Locks possession distribution
what’s happening here:
- we take metrics from locks_influxdb datasource which is configured in our docker-compose file and which we used to send our time series
- we query the metrics with name sweetroll which was the lockName and key of our LockAttemptId
- we count all entries using uniquely generated value of field lockId
- aggregate them into time interval of 10 seconds
- and group by appName which are ‘Diego’, ‘Milten’ and ‘Gorn’ in our case and by eventType, which are one of ‘lockAttempt’, ‘lockBusy’, ‘lockSuccess’ and ‘lockRace’. This shows us 3*4 different time series, and for each of them we can build a separate line or bar chart with timestamp on X axis and amount of events within 10s on Y axis
- also we use value of ‘appName’ ‘eventType’ as legend
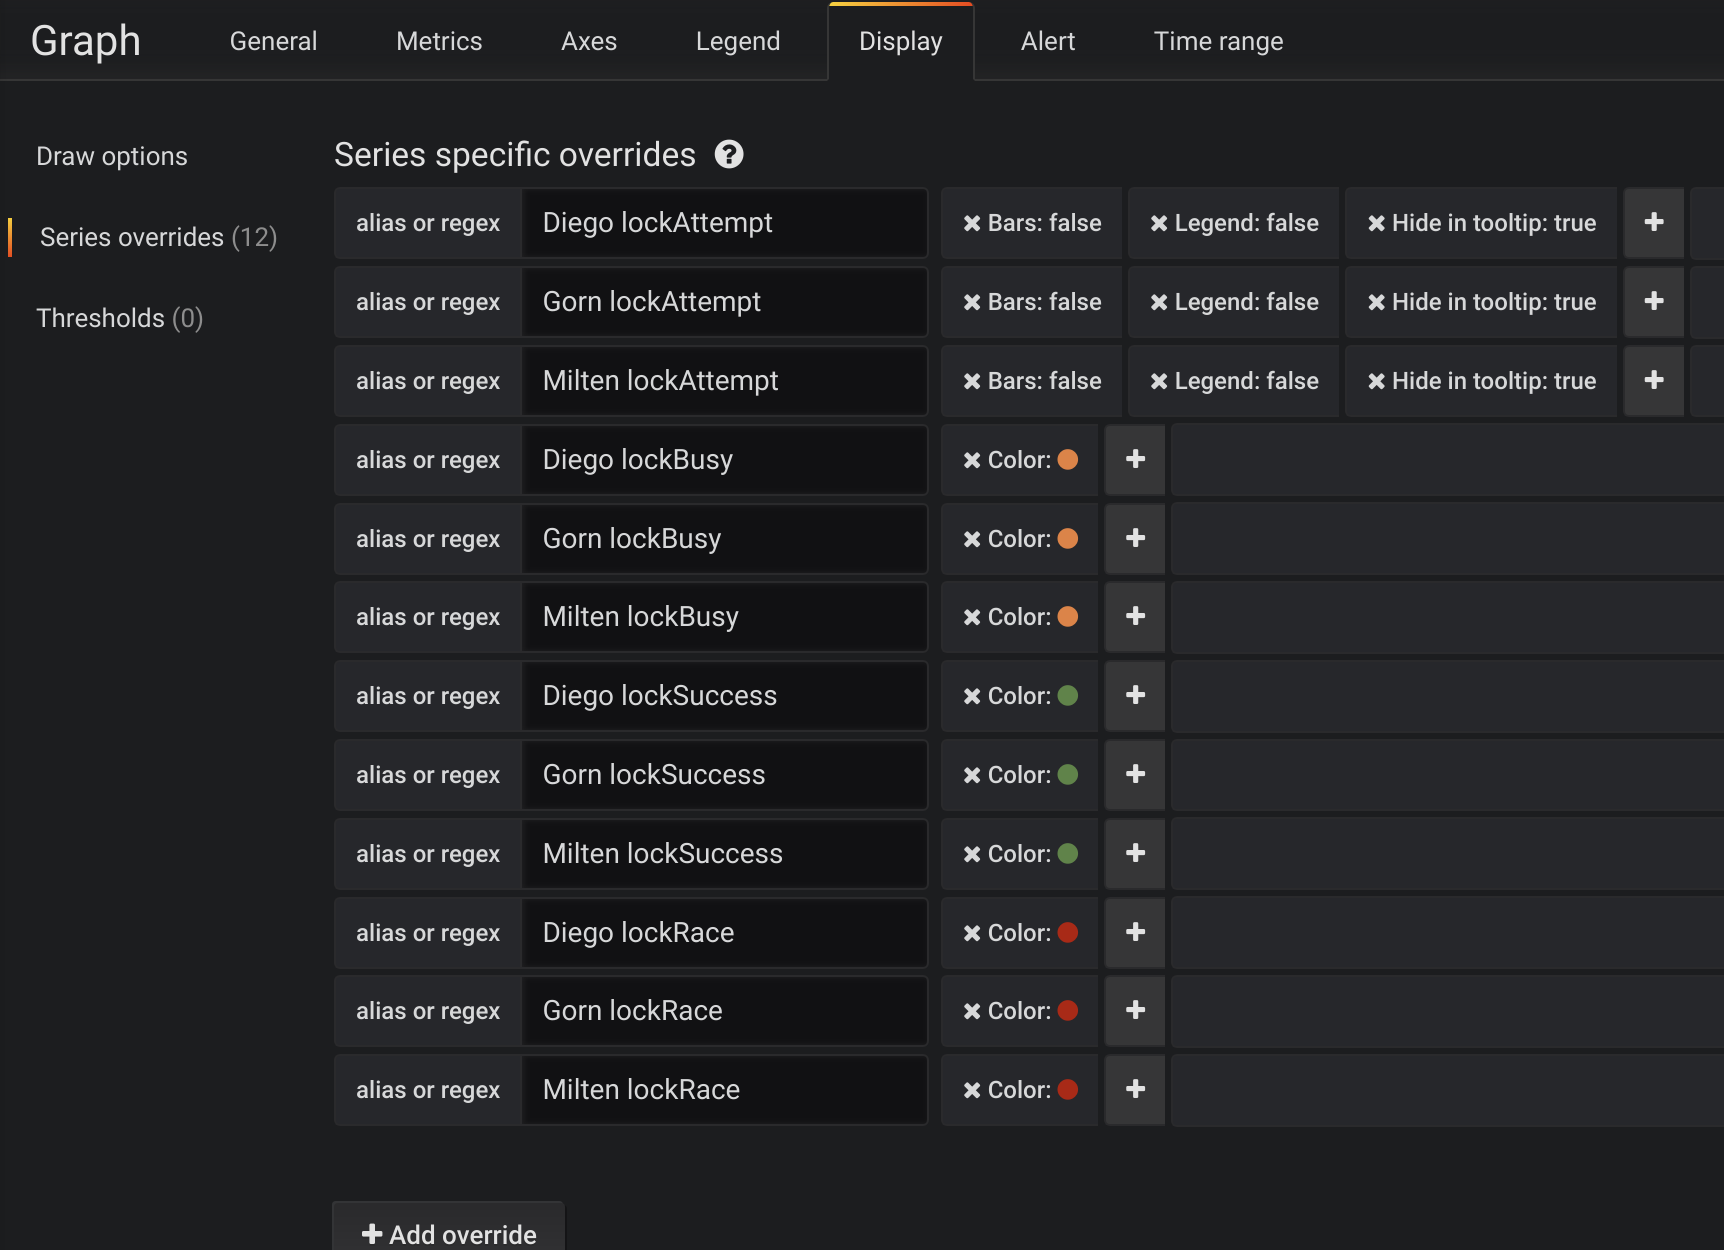
We have no interest in ‘lockAttempt’ event on this chart, we hide it on Display tab and provide colors for each time series:

Configuring custom colors and hiding time series
Our graphic shows which application and how often the critical section ‘sweetroll’ was accessed and how many times this locks was successfully acquired (green color), busy(yellow color) and how many times successful acquiring of it actually resulted in race conditions with other application (red color).

top - 'Diego', middle - 'Gorn', bottom - 'Milten'
In addition, we want to represent: ‘how often each execution has resulted in race condition exceeding initially estimated lock expiration’.

Locks possession exceeded
For that purpose we have the next panel:
showing us which application acquired the lock and how long it took since expiration when it attempted to release it. We distinguish the cases in which we are not sure if these exceedances resulted in race condition (lighter bars) and those where a concurrent process was running (darker ones).
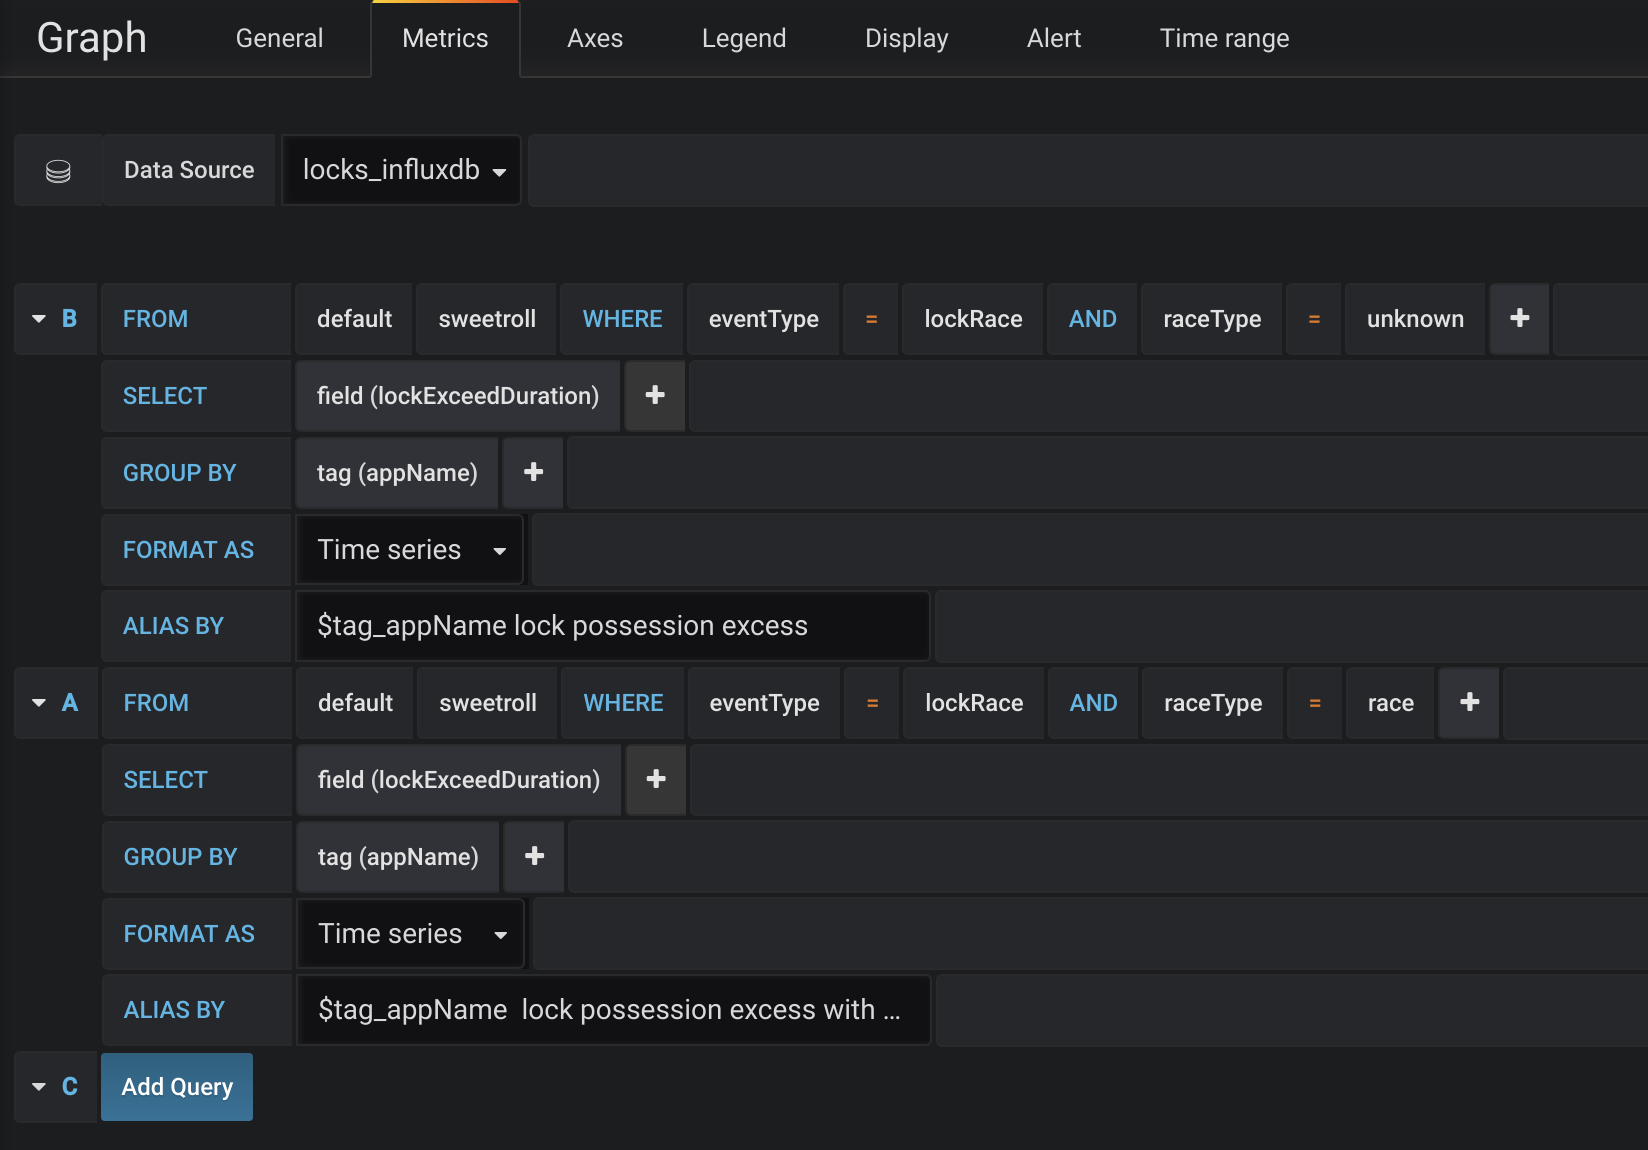
To construct that panel the following metrics configuration was used:

Lock possession exceeded metrics configuration
explained:
- we took all events with type lockRace and raceType=unknown as it was introduced in code above
- select the lockExceedDuration representing the difference between actual processing time and lock expiration time
- and group it by appName
- the same we do for lockRace with type race to select only those, definitely resulted in race condition
We create two separate queries instead of aggregating the results by both appName and raceType to be able to use results of the querying for creating an alert notification:

Configuring an alert
We perform a check every 60 seconds and trigger an alert for all observed events where 5 minutes race condition confirmed to be in a clash with another application. This can be immediately distributed on any channel - Email, Slack channel, etc.
Conclusion
Dealing with systems separated by networks has many implications which are often not imaginable on the beginning of development and concurrent execution and locks is one of these areas. Although the development and use of locks in distributed systems looks fairly simple, there are sharks in a deep water waiting to be discovered and you should be cautious stepping it.
As we saw in our code session, it’s not a problem to implement a locking mechanism with Redis as the underlying system without a framework, but if you ask me if we could mindlessly entrust the crucial concurrently executing parts of our code to locking mechanism based on Redis I’d rather stay a little cautious.
Metrics have been another important part of our story and we should never underestimate their importance. Introducing them makes us take a different look on our code and think about parts of it more quantitative. It’s very straightforward to introduce relevant metrics in most systems, we should consider their usage from the beginning.
And do not forget about the positive part: with metrics, we can use modern monitoring tools and it’s an incredible joy to be able to watch system performing and enjoing fancy graphics, not to mention very useful alerts they could generate.
Got curious about what we do?
Check the site of our Club Mate Guild for other interesting topics or just apply to join us if you have the same passion about IT & Agile as we do.